Business Intelligence & Analytics
Decisions Backed by Evidence
Every leadership meeting where someone asks 'do we actually have the numbers on that?' is a sign the data exists somewhere, just not anywhere useful. We build the dashboards that turn scattered data into decisions made with evidence, not instinct.
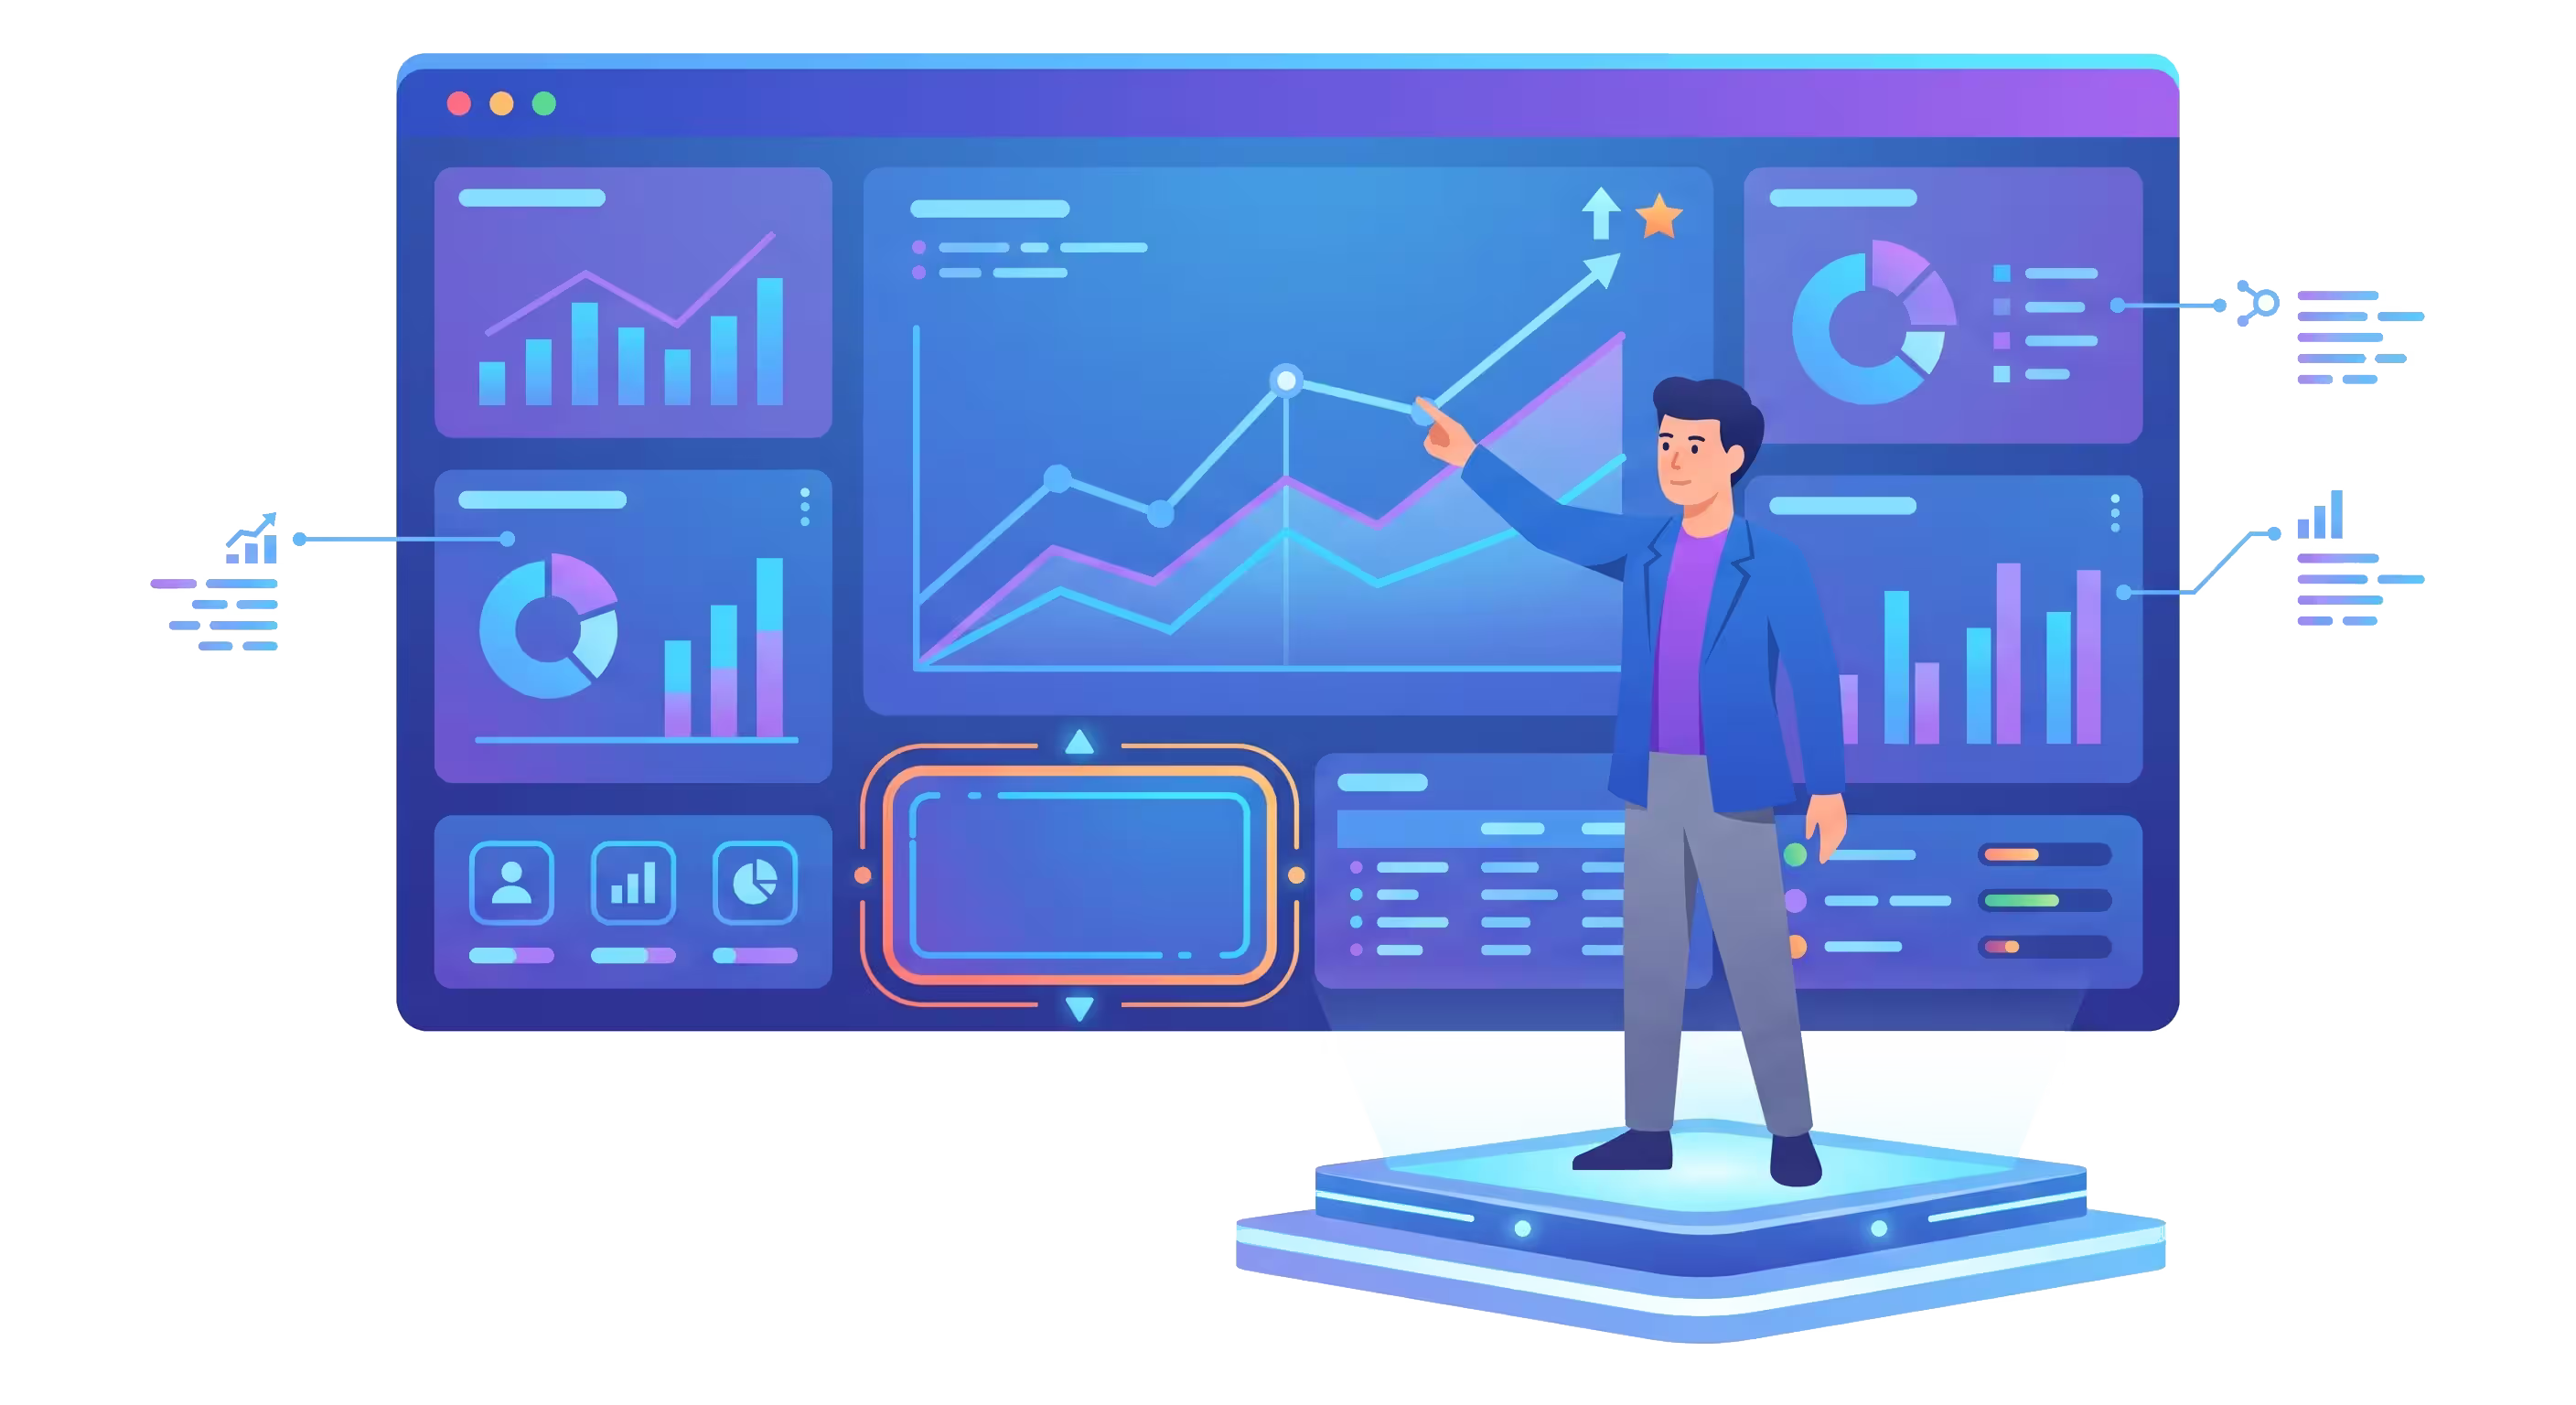
Service Overview
Everything you need to know about how this engagement creates value for your organization.
What is it?
Custom BI dashboards and a unified data layer that turn scattered operational data into real-time, decision-ready visibility.
Who needs it?
Leadership teams making decisions on delayed or incomplete data pulled manually from multiple disconnected systems.
Business Value
Replaces manual, delayed reporting with live dashboards that let leadership see and act on what's actually happening in the business now.
Key Benefits
- Real-time dashboards for the metrics that actually drive decisions
- One unified data source instead of five conflicting exports
- Predictive insights that flag problems before they show up in results
- Reporting your team can trust without re-verifying it manually
Why Is Scattered Data Quietly Slowing Every Decision?
Most businesses have plenty of data. It's just locked in disconnected systems, exported manually, and stitched together under deadline pressure before anyone can act on it.
Reporting means manually pulling exports from five systems
Building even a simple monthly report requires exporting spreadsheets from separate tools and reconciling them by hand, delaying decisions by days.
Different teams report different numbers for the same metric
Without a single source of truth, sales, finance, and operations each calculate the same KPI slightly differently, leading to disputes about whose number is right.
By the time a report is ready, the data is already stale
Manual reporting cycles mean decisions get made on numbers that are days or weeks old, missing the window where the insight was actually actionable.
Nobody sees a problem coming until it's in the results
Without predictive or trend analysis, issues like slowing sales or rising churn only become visible after they've already impacted the bottom line.
Dashboards exist but nobody trusts them
Ad hoc dashboards built without a proper data foundation often show inconsistent numbers, so leadership reverts to manually verifying everything anyway.
Valuable data sits unanalyzed because nobody has time
Operational systems capture rich data that never gets turned into insight, simply because no one owns the job of building the analysis.
What Real-Time BI Actually Changes?
A proper business intelligence layer doesn't just make reporting faster. It changes how early a business can see and respond to what's actually happening.
Leadership sees the current state, not last week's
Real-time dashboards replace the lag of manual reporting cycles, so decisions are made on what's happening now, not what happened days ago.
Every team reports from the same underlying data
A unified data layer eliminates the disputes between departments over whose version of a metric is correct.
Problems surface as trends, before they're results
Trend and predictive analysis flag a slowing metric while there's still time to intervene, instead of after it's already hit the bottom line.
Rich operational data finally gets turned into insight
A proper data warehouse and reporting layer means the data your systems already capture actually gets used, not left unanalyzed.
Where Does the Return Actually Come From?
BI's return shows up in decisions made faster, disputes over data eliminated, and problems caught before they compound in cost.
Faster decision cycles. Real-time dashboards remove the days-long delay a manual reporting process currently imposes.
Eliminated cross-team data disputes. A single source of truth stops the recurring debate over whose version of a metric is correct.
Earlier problem detection. Trend and predictive analysis surface risk while it's still cheap to address, not after it's already cost revenue.
Reduced manual reporting hours. Automated dashboards remove the recurring work of manually assembling reports from multiple exports.
Better resource allocation. Clear, trusted KPI visibility lets leadership direct effort to what the data actually shows is working.
How Does the Engagement Actually Run?
The same disciplined process behind every project, applied to this one.
Data Source & KPI Audit
We identify every system holding relevant data and define the specific KPIs leadership actually needs visibility into.
Data Architecture Design
We design the data warehouse and pipeline structure that consolidates every source into one reliable foundation.
Dashboard Build & Visualization
We build dashboards around how decisions actually get made, not a generic template of charts nobody asked for.
Validation Against Known Numbers
We validate the new dashboards against numbers your team already trusts, so confidence is established before rollout.
Rollout & Ongoing Refinement
We roll out to leadership and relevant teams, then refine the dashboards as real usage reveals what's actually being acted on.
What Actually Happens During the Build
No black box. Here's what you're involved in, and what you're handed at the end.
- A documented audit of data sources and defined KPIs before dashboard design begins
- A consolidated data warehouse pulling from every relevant system
- Real-time dashboards built around actual decision-making needs
- Validation against numbers your team already trusts, before rollout
- Predictive or trend analysis where the data supports it
- Documentation and training so your team can extend the dashboards independently
What's a Realistic Timeline?
Scoped ranges, not vague promises. The exact plan is confirmed after discovery.
Audit & KPI Definition
1 weekData source mapping and defining what leadership actually needs to see.
Data Architecture
1–2 weeksData warehouse and pipeline design consolidating every source.
Dashboard Build
2–4 weeksVisualization development and validation against trusted numbers.
Rollout & Refinement
OngoingTeam rollout and iterative refinement based on real usage.
What Technology Is Behind It?
We pick the right tool for the outcome, not the newest one for its own sake.
Data Layer
Visualization
Analytics
What Results Have We Delivered in Business Intelligence & Analytics?
Real outcomes from business intelligence & analytics engagements, not manufactured claims.
A multi-branch retail and services group
Monthly leadership reporting required manually exporting and reconciling data from sales, finance, and inventory systems, often taking a week to assemble and already stale on delivery.
We built a consolidated data warehouse and real-time dashboards covering sales, finance, and inventory KPIs, validated against the leadership team's existing trusted figures.
Leadership now sees current performance in real time instead of waiting a week for a manually assembled report, and the recurring disputes over whose numbers were correct have stopped.
Paired Services
Capabilities that pair naturally with this one.
Other Solutions
Purpose-built systems that solve adjacent problems.
Who This Is Built For
See how this looks in practice for a specific industry.
Questions About Business Intelligence & Analytics
The practical details behind how we deliver this specific service.
Not necessarily. We audit what's already working and typically rebuild the underlying data layer where it's unreliable, while reusing dashboard designs your team already trusts.
Ready to Make Decisions on Evidence, Not Guesswork?
Tell us which decisions currently wait too long for data. We'll show you exactly what real-time visibility would change.